I’m developing a Shopify app built with Remix CLI and Shopify Polaris. I’ve been running Lighthouse audits to monitor its performance, and I’ve observed a significant discrepancy between runs in incognito mode versus a regular Chrome profile on the same system and configuration.
Here are my observations:
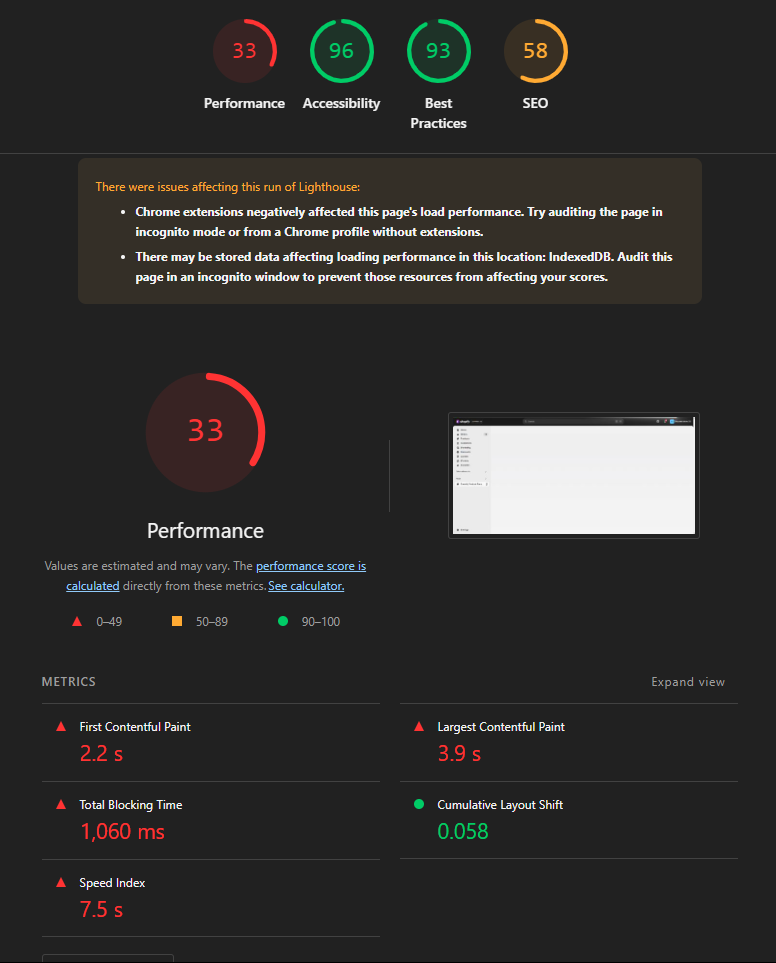
Regular Chrome Profile: Performance score of 33 .
First Contentful Paint (FCP): 2.2 s
Largest Contentful Paint (LCP): 3.9 s
Total Blocking Time (TBT): 1,060 ms
Speed Index: 7.5 s
Lighthouse also noted that “Chrome extensions negatively affected this page’s load performance”.
Incognito Mode: Performance score of 49 .
First Contentful Paint (FCP): 1.7 s
Largest Contentful Paint (LCP): 3.3 s
Total Blocking Time (TBT): 330 ms
Speed Index: 3.5 s
The warning about Chrome extensions was absent, as expected.
Both runs consistently show a warning about “stored data affecting loading performance in this location: IndexedDB”.
My questions for the community are:
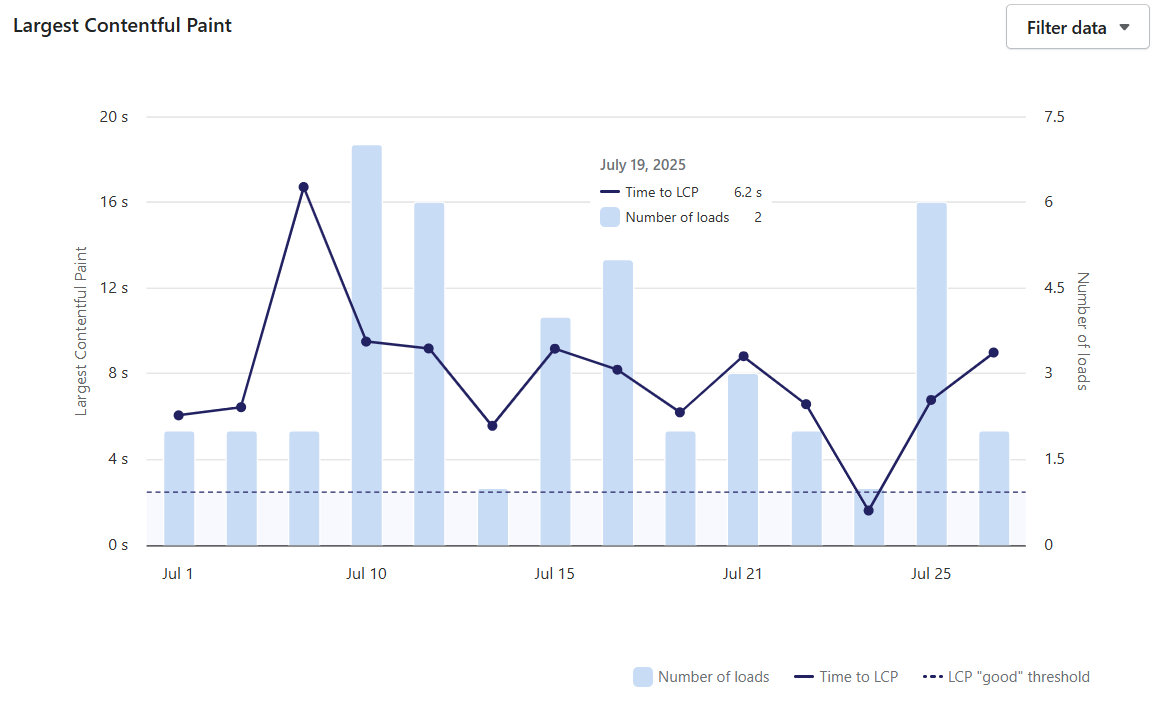
LCP Calculation for “Built for Shopify” Apps: Given that our app runs embedded within the Shopify admin as an iframe (a “Built for Shopify” app), how does Shopify typically calculate Largest Contentful Paint (LCP) in this specific context? Are there any nuances or considerations when measuring LCP for apps embedded this way that might not apply to standalone websites?
Improving Performance from 49 (Incognito Baseline): Even with the improved score of 49 in incognito mode, our app is still in the “needs improvement” range. Based on the common issues for Remix/Polaris apps (high JavaScript execution, long main-thread tasks), what specific areas or strategies should I prioritize to further improve the performance, particularly LCP and TBT?
Are there common pitfalls or best practices unique to Shopify app development (Remix/Polaris specifically) that contribute to these metrics?
Any recommendations on how to effectively profile and reduce the impact of Shopify-hosted scripts like render-co_...js and router-v1_...js which seem to contribute significantly to main-thread work?
Any insights or guidance would be greatly appreciated! Thank you. @Liam-Shopify
I can’t guarantee a specific answer to the questions here, but I’ll connect with the team on my end to see if we can offer any further optimization tips or information. I’ll loop back with you here as soon as I have more to share.
Hi @Alan_G
Thanks for the detailed response and for providing the link to the documentation on admin, installation, and OAuth performance. The information will be reviewed thoroughly. It is appreciated that the team will be contacted for further optimization tips as well. Awaiting a response.
Hey @adarsh_anncode - no worries at all! I was able to touch base with some folks internally on our end who work with our LCP calculations and I just wanted to share some information on how we calculate LCP for apps/BFS.
Essentially, the content in the app frame is treated as a standalone website. One way you can try to simulate this would be running the app in a headless mode and tracking the performance that way.
One other thing that I can share is that we test apps using incognito so the performance there in Incognito should match what you’re seeing on your end (and be toward your benefit, if that makes sense )
In terms of recommendations for improvement, I’d focus on reducing your JavaScript bundle size first if you can. I’m not entirely sure how your app works, but my recommendation would be to try code-splitting and lazy loading non-critical Polaris components that aren’t needed immediately on page load.
Since you’re using Remix, you could potentially use its defer functionality to load critical data first while deferring things like reviews or analytics data, which will help unblock your main thread. The other thing to make sure would be preloading critical resources like fonts and stylesheets with resource hints, and leveraging Remix’s SSR capabilities to render more content server-side instead of relying on client-side JavaScript.
Hope this helps - let me know if I can clarify anything else on our end here.
My app is also facing an issue with the LCP score too high to process the application to the Built for Shopify badge, so my ideal is where can we move all the queries in the remix loader into the component side (eg, use useEffect to call API), whether it solves our issue or not?
Hey @huykon225, thanks for flagging that Github issue. I can’t guarantee anything on our end here, but I’ll reach out to some folks internally to see if we can share any updates on the defer issue there.
When it comes to moving loader queries into useEffect, I don’t believe we restrict this, but if that data is needed for above-the-fold content, moving it client-side might increase LCP load times if the largest element can’t paint until the client fetch completes. It should work as a workaround though, so if you’d like to go that route it’s definitely feasible, but may decrease BFS metrics.
I’ll loop back with you once I have more info to share on the defer issue, hope this helps a little bit in the meantime!
Hi @Alan_G
Thank you for responding.
I will be looking forward to your signal about defer issue inside the iframe.
For the client’s request API approach. Do you think if we show a page loading skeleton will help reduce the LCP score?
I know that Shopify recently released Polaris Web component instead of the older React component. Do you think using that will help reduce the LCP score?
@huykon225 I don’t think using loading components or skeletons will improve your LCP score.
I already had those implemented, but I’m still getting a high LCP.
I also read in an article that your server configuration plays a major role in LCP. Implementing caching for large data fetched from the database can also help improve your LCP score.
Could you also explain about older React components?
Hi all just following up here to share an update. I was able to touch base with our product team on this and we are investigating this as a potential bug on our end. I also just wanted to confirm that after some digging, we noted this is an issue with App Bridge, rather than the React library itself.
When it comes to improving LCP scores, @adarsh_anncode is on point here. Caching is one of the best ways to reduce TTFB (time to first byte), but another major blocker folks run into is optimizing images. A quick win for image optimization is using a format like WebP instead of standard JPGs, etc: What Is a WebP File? How WebP Compares To JPEG and PNG (2025) - Shopify Canada
Our team (Developer Support) can’t provide specific support when it comes to LCP/BFS performance questions, but hopefully the above is a bit helpful.
I’ll keep my eyes on things for you as far as the issue goes and update you as soon as I have more info to share or if we need next steps from you folks. I can’t guarantee a timeline, but I’ll loop back as soon as I have more to share. Really appreciate your patience on this
Thank you for your message @Alan_G
My app images were using the WebP format at all & I also don’t use any external custom CSS; I used all from Polaris React Components.
I hope we will have a way to improve the LCP score for my app, especially my remix loader, which only calls 1 API from GraphQL Admin. Hope to get the news App Bridge fixed version from your signal in the next days.
Hey @huykon225 - just following up here. We pushed a fix recently that should resolve the issue with defer you reported. Can you let me know if you’re still seeing the issue? If so, happy to look into that further, just let me know and I’ll take a look.
Hey @huykon225 , no worries. We generally advise staying on the newest available version of our libraries/SDKs if possible. For the above, you’d want to use:
Remix: 3.8.5
App Bridge React: 4.2.2
API: 11.14.1
Hope this helps, let me know if I can clarify anything on my end here as alwaus!
I’ve updated the code in the loader using defer, but the LCPs are still high. And I also check the request network for the document is still high. It takes 2-5s, I don’t know what the main reason is. Can you know the reason or any advise here?
Hey @huykon225 — thanks for the update and sorry to hear you’re still seeing issues.
Usually, a 2–5s “document” time generally points to backend/TTFB or payload size rather than an issue withinApp Bridge or Polaris itself. One thing you can try, in Chrome DevTools, is check the initial document’s TTFB (time to first byte) vs download time; if TTFB dominates it’s loader/server work, if download dominates the HTML/JS is heavy.
You can also add Server-Timing headers in your Remix loader to time the GraphQL call and render so we can see exactly where the time goes.
For the Admin GraphQL call, what I’d do is log extensions.cost, trim any fields fields/connection you don’t need or split queries if they are too large/expensive.
You might also want to consider moving non‑critical data out of the loader to fetch after first paint. The best practice is to keep your initial payload lean in the product production build if possible. If you can share the shop/route, a HAR or waterfall of the initial nav, your Server‑Timing output, and the GraphQL query plus extensions.cost, I’m happy to dig in with you to see if I can provide any more guidance though. Hope this helps a bit!
I tried to move all the queries to the client side, and my route loader is empty with only authenticate:
await authenticate.admin(request);
It’s working well on my localhost with the initial request “Document” time about 200-300ms, until I pushed my code into PROD (I’m using Flyio with 3 machines), the request time is still old, with almost time to waiting for server response. Do you have any advice on this?